


The great folks at ControlUp grant each #vExpert, #CTP, #MVP and #NutanixNTC a free annual NFR license for their home-lab. This post will describe the easy setup of ControlUp for The LAB.
Michael White did a similar write-up, so please check that one out also to ensure you don’t miss anything if you want to get rolling with ControlUp
First off I will download the free trial from their website:

A zip file -containing the executable- is downloaded, which I will extract to a folder on my PC. I create a shortcut to the executable on my Desktop

and launch the executable. The application starts and I need to select Create a new account.

I need to Sign up for ControlUp (has a nice ring to it :)), so I will provide my details and hit Sign Up

I need to validate my email address, so I check this and click OK, after which the sign

I get an email from ControlUp to active my account, so I click the provided link in there and whoop, whoop, the activation was a success.

So now back to the console. I need to create a ControlUp Organization to define my security boundaries, and will name this (surprisingly) lab.damen-online.nl and click Continue

The organization will be created and the console is launching and showing me an empty organization

Okay, checking the requirements to install the agent on my VM’s first and I ensure these are enforced via the Default Domain Policy
- RPC Access must be allowed
- WMI Access must be allowed
- TCP port 40705 must be open for Agent communication
- ICMP Access allowed (although this is not a hard requirement as you can disable the ping test in the Agent settings within ControlUp)

After the GPO has been updated and applied to my machines, I add some VMs to ControlUp. This has been made very easy, just click the button Add Machines.

Active Directory is scanned and I select the machines that I want to be monitored and click OK.

After a couple of minutes I see my machines in the console reporting

So that’s pretty easy, so now checking how I can add my Nutanix host in there, and yes you wouldn’t expect but it’s as easy :). Best practice is to create a new account on the Prism Cluster, so I will first do this. I open my browser, connect to the cluster, go to Settings | Local User Management and click +New User.

I will create a local user on the cluster for ControlUp and follow best practices to assign the viewer role only to this account. This means that if you want to perform any actions from within ControlUp on the cluster, I need to provide my Cluster admin credentials (which I’m fine with). After providing all details, I click Save.

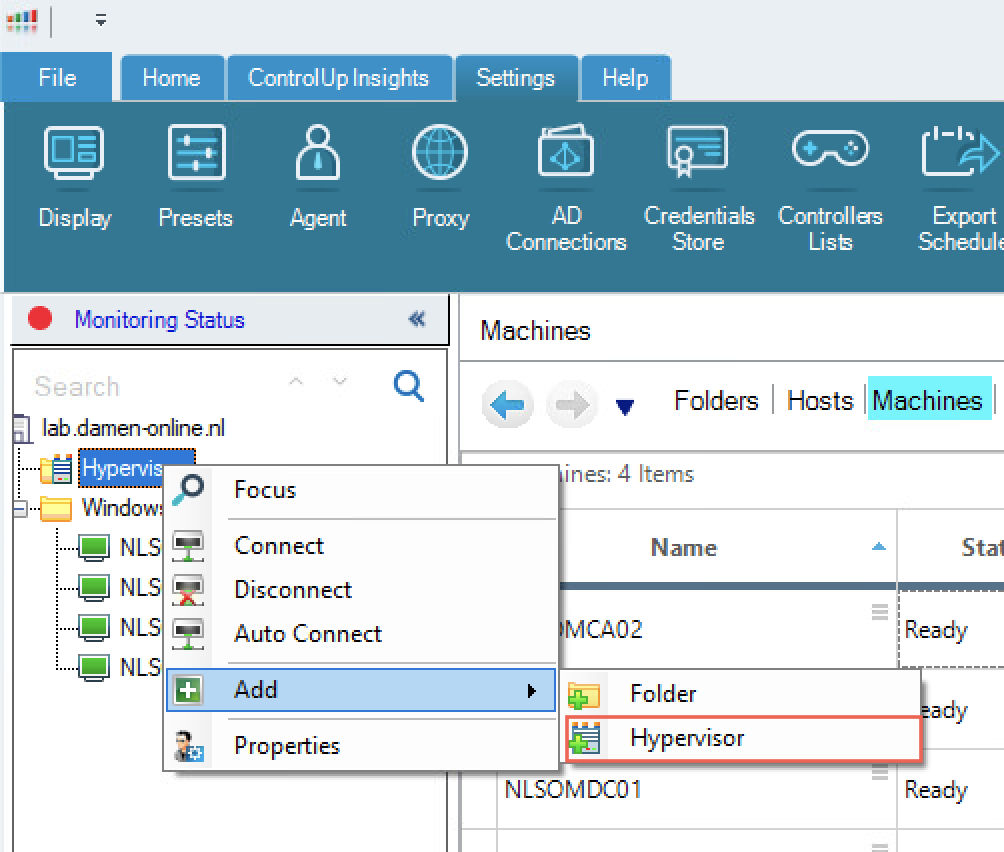
Now back to the ControlUp console to add my Nutanix host. I right-click on Hypervisors and select Add | Hypervisor.
I provide the correct details to connect to my Nutanix host and click OK. As ControlUp will use the native Nutanix Prism API, there is no need to install any agent there.

And as easy as adding the Windows VMs, my Nutanix host is also added and my host is also being monitored.

Okay this is all setup quite fast and without any issue, but to ensure I have continuous monitoring and auto-remediation in place I need to setup a ControlUp monitor.
This is a component principally equivalent to ControlUp Console but without an active user interface.
To install the ControlUp monitor I need to ensure I meet the requirements:
- Windows Server 2008 R2 or later
- .NET Framework 4.5 features enabled
- RPC access must be enabled
- Powershell 5.0
- TCP port 40706 (default) open in the firewall
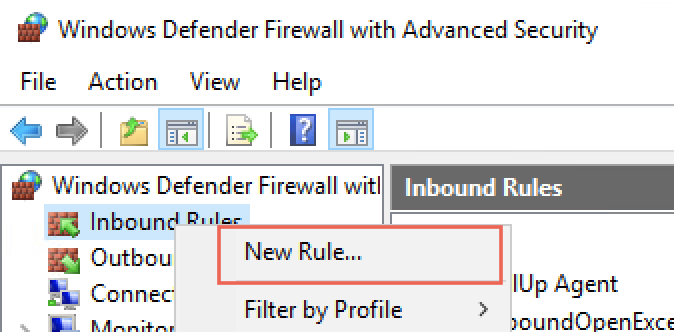
I need to open the TCP port on my VM where I will install the monitor, but otherwise I’m good. I will connect to NLSOMCC01 (where the monitor will be installed) and open Windows Defender Firewall with Advanced Security where I right-click Inbound Rules and select New Rule…
The New Inbound Rule Wizard starts, asking what type of rule I would like to create. I choose Port and click Next

Next I select the correct protocol (TCP) and port (40706) and click Next

Of course I want to allow the connection

and want to apply this rule in all circumstances:

I provide a name (ControlUp Monitor) for this rule and click Finish

So now I’ve met the requirement I can deploy the monitor. For this I go back to the machine where I’m running the ControlUp Console. I go to ControlUp Insights and click Manage Monitors

There are no monitors added (first setup) so I click Add Monitors to Site

ControlUp makes it really easy as it provides me a list of the Windows machines, so only thing I have to do is to select the VM I want (NLSOMCC01) and click Install

After a couple of minutes, the ControlUp Monitor Server is installed:

After clicking Finish I’m returned to the main overview and after a few minutes I see the monitor is running, so I can go to the next part.

ControlUp Insights
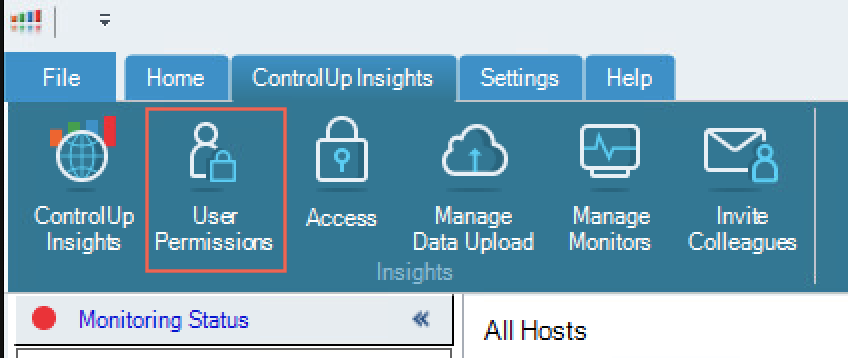
I will enable Insights access to my account, so I can check my environment remotely. To do this I go to ControlUp Insights and click User Permissions
I tick the boxes “Permitted to use ControlUp Insights” and “Allow new members of this organiztion to access ControlUp Inisghts” and click OK

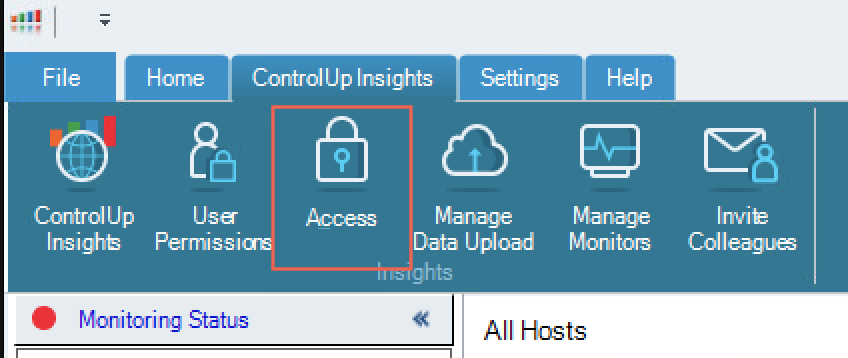
I also want to enable 2FA for my account so I click Access.
A new window opens and I enable Two-factor authentication for accessing Insights, don’t put any restrictions in place (until somebody else tries to access), and enable single sign-on from the console (so I don’t need to re-authenticate as this is from a trusted source).

So now I go to https://insights.controlup.com and authenticate with my email and click Sign In

As I enabled MFA I need to provide the secondary authentication code that I received via email and click Continue

After I’m authenticated I’m presented with the next view, so I need some patience.

So after a few hours waiting, the data is uploaded

So my LAB is nicely monitored, I can check from anywhere -with internet access- what’s going on and can now implement some actions, but that’s for a later time :).